Apple Inc. (AAPL) Up 3.9% Since Earnings Report: Can It Continue?
A month has gone by since the last earnings report for Apple Inc. AAPL. Shares have added about 3.9% in that time frame, outperforming the market.
Will the recent positive trend continue leading up to the stock's next earnings release, or is it due for a pullback? Before we dive into how investors and analysts have reacted of late, let's take a quick look at the most recent earnings report in order to get a better handle on the important catalysts.
Apple Q2 Earnings and Revenues Beat, Increase Y/Y
Apple reported second-quarter fiscal 2017 earnings of $2.10 per share and revenues of $52.9 billion, easily beating the Zacks Consensus Estimate of $2.02 and $52.6 billion, respectively. On a year-over-year basisApple, earnings grew 10.5% and revenues increased 4.6%.
Quarter in Details
Total iPhone unit sales came in at about 50.7 million, down 1% year over year. However, revenues from iPhone grew 1% from the year-ago quarter to $33.3 billion (62.9% of total revenue).
Services— including revenues from Internet Services, App store, Apple Music, AppleCare, Apple Pay, and licensing and other services—surged 18% year over year (with an extra week in the quarter) to nearly $7 billion. App Store sales grew 40% year over year.
Management also noted that Apple Pay reported transaction volume growth of 450%, buoyed by expansion to markets like Taiwan and Ireland. At present, Apple Pay is available in 15 markets.
Apple Mac unit sales were up 4% year over year to approximately 4.2 million, while revenues grew 14% from the prior-year quarter to $5.8 billion.
Coming to iPad, Apple sold 8.9 million units in the quarter, down 13% year over year. Revenues of $3.9 billion were down 12% from the prior-year quarter.
Other products—including revenues from Apple TV, Apple Watch, Beats products, iPod, and Apple-branded and third-party accessories—increased 31% year over year to over $2.9 billion.
Geographical Performance
Demand for Apple’s products improved across most of the geographical regions except greater China. As much as 65% of sales were from the International markets.
The Americas (the biggest market for Apple) generated revenues of approximately $21.2 billion in the quarter, up 11% year over year.
Europe generated nearly $12.7 billion in revenues, up 10% on a year-over-year basis.
Revenues from Japan rose 5% year over year to $4.5 billion while the rest of Asia Pacific generated revenues of $3.8 billion, up 20% year over year.
Owing to persistent macroeconomic weakness, Apple revenues declined around 14% year over year in the Greater China region to $10.7 billion.
Margins
Gross margin was 38.9%, a decline of 50 basis points (bps) from the year-ago quarter.
Operating expenses increased 9.4% year over year to $6.5 billion due to higher research & development expenses as well as selling, general and administrative expenses. As a result, operating margin plunged 100 bps from the year-ago quarter to 26.7%.
Balance Sheet and Cash Flow
Apple’s cash and cash equivalents (and short-term marketable securities) were $67.1 billion at the end of the quarter and long-term debt was $84.5 billion.
For the six months ended on Apr 1, 2017, cash generated from operating activities was $39.6 billion.
Apple returned about $10 billion this quarter through dividends and share repurchases. It has also increased share repurchase authorization by $50 billion, taking total authorization to $300 million and extending expiration to Mar 2019. From Aug 2012 to Mar 2017, Apple has returned $211 billion to shareholders.
The company also raised its quarterly dividend by 10.5% to $0.63 per share, payable on May 18, 2017 to shareholders of record as on May 15.
Guidance
For the third quarter of fiscal 2017, Apple forecasts revenues in a range of $43.5–$45.5 billion.
Gross margin is expected within 37.5–38.5%, while operating expenses are projected within $6.6–$6.7 billion. Operating expenses will be in the range of $6.6 billion and $6.7 billion. Other income/ (expense) is likely to be $450 million, while tax rate is expected to be 25.5%.
How Have Estimates Been Moving Since Then?
Following the release, investors have witnessed an upward trend in fresh estimates. There have been four revisions higher for the current quarter compared to three lower.
Apple Inc. Price and Consensus
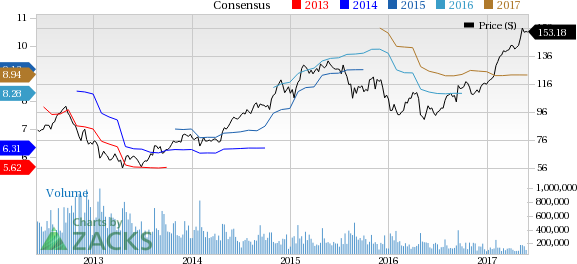
Apple Inc. Price and Consensus | Apple Inc. Quote
VGM Scores
At this time, Apple's stock has an average Growth Score of 'C', though it is lagging a bit on the momentum front with a 'D'. The stock was allocated a grade of 'B' on the value side, putting it in the second quintile for this investment strategy.
Overall, the stock has an aggregate VGM Score of 'C'. If you aren't focused on one strategy, this score is the one you should be interested in.
Our style scores indicate that the stock is more suitable for value investors than growth investors.
Outlook
Estimates have been trending upward for the stock. The magnitude of these revisions also looks promising. Notably, the stock has a Zacks Rank #3 (Hold). We expect in-line returns from the stock in the next few months.
Want the latest recommendations from Zacks Investment Research? Today, you can download 7 Best Stocks for the Next 30 Days. Click to get this free report
Click for Free Apple Inc. (AAPL) Stock Analysis Report >>
To read this article on Zacks.com click here.
Zacks Investment Research
