Excel and PowerPoint are better together. Excel is an amazing tool to create, organize and analyze data with. PowerPoint shines when it's time to present and share your hard work with an audience. Embedding Excel into PowerPoint is a win-win for both!


What happens when we want to combine each app's strengths? When you're ready to take your data and charts from Excel to PowerPoint, you have options. There are different ways to paste and link your data between these apps.
In this tutorial, you'll learn how to embed or link an Excel file in PowerPoint. Soon, you'll know how to embed Excel graphs and charts inside of a PowerPoint presentation. Embedding Excel into PowerPoint is a top skill in 2023, and you’ll find yourself doing it every day.
Need Help? Download Our eBook on Making Great Presentations (Free)
We also have a useful complement to this tutorial. Quickly grab it before you read on. Download our FREE eBook: The Complete Guide to Making Great Presentations, which will help you write, design, and deliver the perfect presentation.


How to Embed Excel Files & Link Data into PowerPoint (Quick Video)
In this quick three minute screencast below, I'll show you how to work back and forth between Excel and PowerPoint. You'll learn to embed Excel files in PowerPoint, link your data between the two apps, and can keep your data up to date.
Read on to learn more about different methods for working with data between Excel and PowerPoint.
How to Embed Excel Charts in PowerPoint
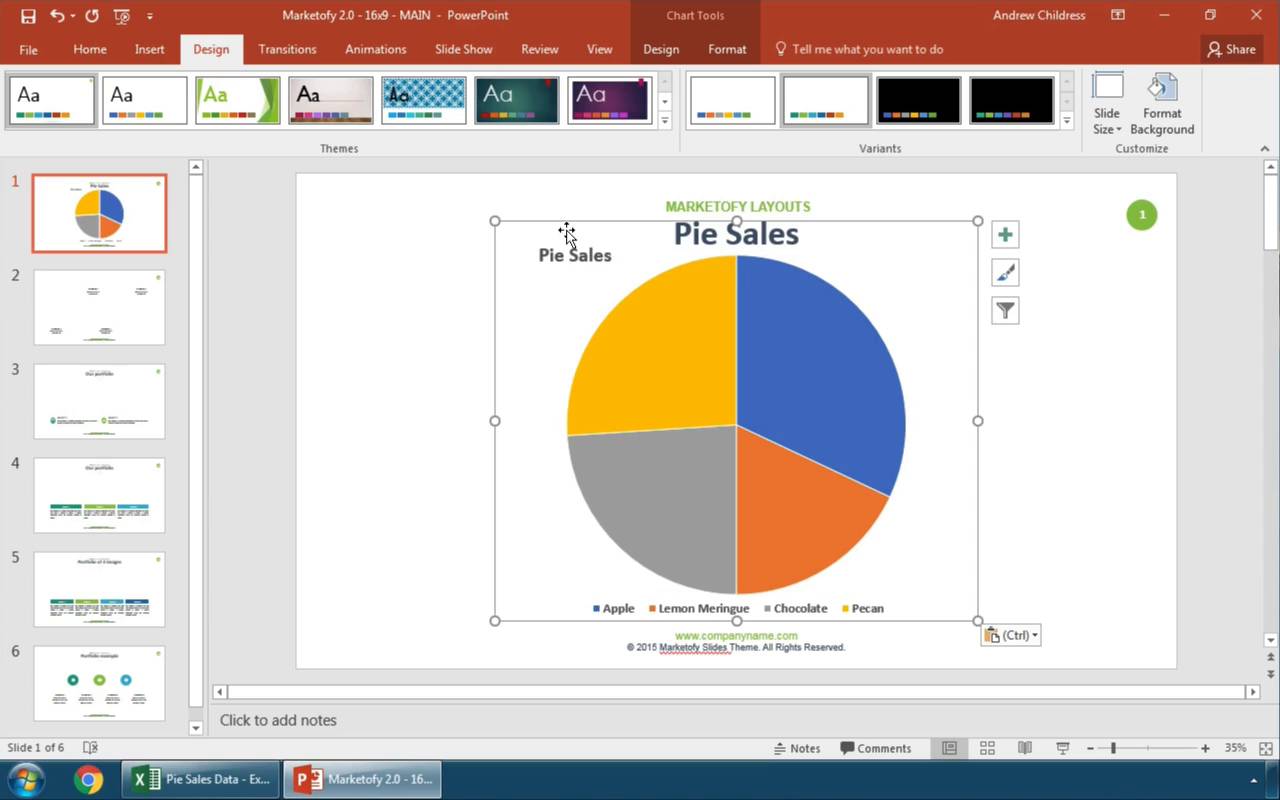
Imagine that we’ve built a great-looking Excel chart. It features plenty of data and a stylish design aesthetic. But Excel isn’t the best tool for sharing with an audience. It’s best to embed Excel in PowerPoint to present with.
But you might not be done making style changes. Fortunately, you’re in luck.


Throughout this tutorial, you’ll see the SIMPLECO PowerPoint template featured. It’s a robust premium design from Envato Elements. Download it today to follow along.
Start Embedding Excel Into PowerPoint
Now, let’s get started with the simplest way to make a PowerPoint embedded Excel. The first step is to click on your chart inside of Excel and make sure it's selected. Then, you can press copy, either by pressing Ctrl + C on your keyboard or pressing the Copy button on Excel's ribbon.


Now, let's switch over to the SIMPLECO template, which is open in PowerPoint. Find some space on one of your slides. Then, press either Ctrl + V on your keyboard, or press the Paste button on PowerPoint's ribbon. Below, you can see that the data and amounts match when you paste.

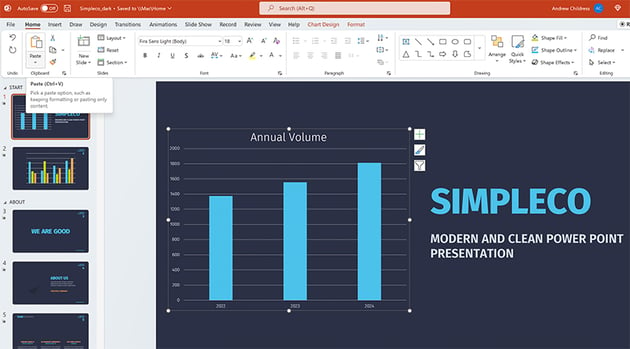

Notice that it brought over the same data from our Excel workbook, but it reformatted the style to match the PPT presentation. These are the default options to take charts from Excel to PowerPoint.
This is the most basic way to place an Excel chart inside your PowerPoint file. But as always, there's more power hidden behind the scenes in PowerPoint.
Excel to PowerPoint Paste Options Explained
Maybe you want to paste your chart as a picture that the viewer can't edit. Or maybe you want to link your Excel chart to PowerPoint so that they update data and stay synced.
When you're taking charts from Excel to PowerPoint, you really have two choices to make:
- How do you want to handle the data - should it be linked to an Excel workbook, or embedded right inside the PowerPoint file?
- Should the style of the chart stay the same, or should it match the rest of your presentation?
These options are all available when you Right-click inside PowerPoint with a chart on your clipboard.


There are actually five ways that you can take data from Excel to PowerPoint, and each of them handles your data a bit differently. For your reference, here are the descriptions of each of the paste options in PowerPoint:
- Use Destination Theme and Embed Workbook
- Keep Source Formatting and Embed Workbook
- Use Destination Theme and Link Data
- Keep Source Formatting and Link Data
- Paste as picture
I think of the major categories as embedding, linking, and pasting as a picture. Let's learn about each of those categories.
1. Embed Excel Workbook in PowerPoint
The first two icons (1 and 2) allow you to embed data inside the PowerPoint file. This means that PowerPoint stores the data behind the scenes inside the PowerPoint file.
Once you paste the file in and embed the workbook, the data is separated from the Excel file and stored inside the PowerPoint file.


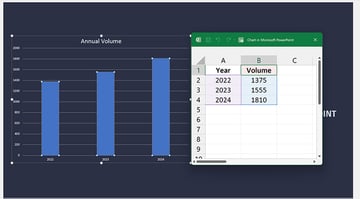
To update the data inside of an embedded Excel file, you can right-click the chart and choose Edit Data from the menu. This opens an embedded Excel spreadsheet inside the PowerPoint file where you can edit the data in the chart.


Embedding data has many advantages. The charts in your presentation work whether or not you've got access to the original Excel file. Embedding does increase the size of your PowerPoint file.
The major downside to embedding data is that it doesn't stay synced to the Excel file that you're doing analysis and data review inside of. If you're going back and forth between the two apps, linking might be a better choice.
2. Link Excel Data to PowerPoint
Linking data (icons 3 and 4) keeps your PowerPoint and Excel file in sync. If you change the data for the chart in Excel, you can update the pasted chart in PowerPoint to use the latest data.
When PowerPoint and Excel are both open at the same time, this happens automatically for linked data. Make a change in Excel, and the linked PowerPoint chart updates in real time.
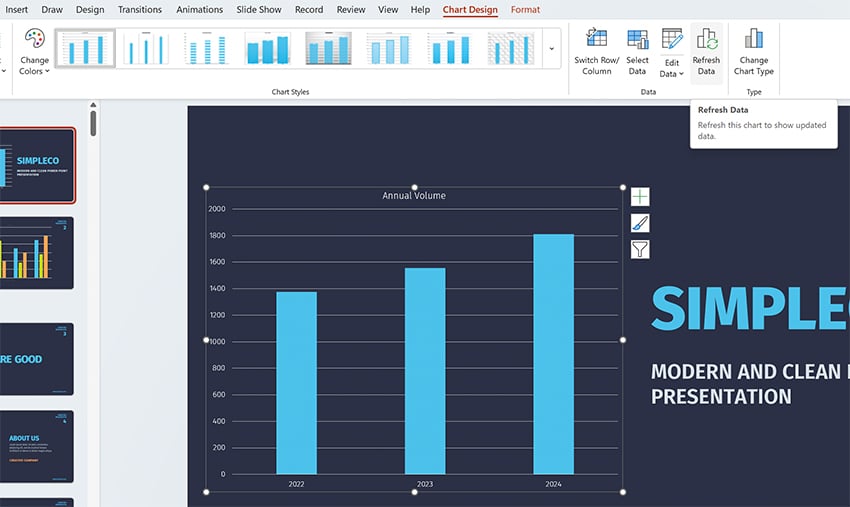
If you're working in Excel and PowerPoint at different times, you'll want to update your data. Make sure to hit Refresh Data on the Chart Design tab on PowerPoint's ribbon.


Linking is great to keep the data connected so that you don't have to keep rebuilding your charts as you move from Excel to PowerPoint.
But linking your data directly to Excel isn't always the right choice. The downside to using the linked option is two-fold:
- If you send your PowerPoint file to someone and they don't have access to the Excel file, refreshing data won't work.
- If others are changing the linked Excel file behind the scenes without your knowledge, you run the risk of updating your presentation with incorrect data.
If you're still a bit fuzzy about choosing between embedding and linking data from Excel to PowerPoint, check out the official Microsoft help page to see a comparison of the two.
3. Paste Excel Chart as Picture in PowerPoint
The final option to place a chart in PowerPoint is to simply paste the chart you built in Excel as a flattened, non-editable picture.
When you paste a chart as a picture, the styles will appear the same as the Excel version of the chart and no longer be editable within PowerPoint.


This feature is handy when you want to ensure that the data isn't changed or altered by the recipient. But pasting as a picture causes you to lose any ability to edit or change the chart.
Excel to PowerPoint Paste Formatting Options
Whether you choose to embed or link your data, you can choose how to handle the style of your charts when you move from Excel to PowerPoint. Both "embed" and "link" options have two choices for how to handle styling.
Let's look at the difference between "Use Destination Theme" and "Keep Source Formatting." These options don't change the way we work with data—both options embed your data in the PowerPoint file—but they do change the appearance of the charts.
- Keep Source Formatting. Uses the same chart style used in Excel.
- Use Destination Theme. Matches the style of your chart to the PowerPoint theme.
In the screenshot below, you can see examples of each option. Using Keep Source Formatting kept the chart exactly the same as it appeared in Excel. Use Destination Theme helps your charts blend in with the rest of the presentation.


Once a chart is placed in the PowerPoint file, you can edit and restyle the presentation. Think of this paste option as the starting point.
5 Quick Tips to Effectively Share Data in PowerPoint
We’ve learned about embedding Excel into PowerPoint. As you can see, linking the two apps is a seamless process. It helps you keep data and charts up to date to share with your audience. But sharing data can still seem daunting. What are some good rules of thumb? What do you need to do to succeed?
Read on for five of my favorite tips for effectively sharing data in PowerPoint. Embrace these ideas to succeed in 2023:
1. Opt for Colorful Styling
Bland, flat styles never inspired anyone. The trick is to use bright, colorful styles. You’ll enjoy several benefits when you do this. First, you’ll have shareable charts that are creative and engaging. You won’t bore your audience.


Plus, the creative use of color helps add contrast. For example, if you’re sharing charts, you can make each data series a different color. This makes your PowerPoint embedded Excel much easier to read and understand.
2. Animate to Control the Pace and Flow
Data is best shared as part of a narrative flow. In other words, you don’t always want your audience to see it all at once. That’s especially true if you’re providing details along the way. Data without context is “information overload” and can quickly become confusing.
Using animations in PowerPoint is a great way to control the pace and flow of your data slides. You can present Excel-based data in a certain order, rather than all at once.
Learn how with our full tutorial on PowerPoint’s Animation pane, the control center for slide animation:
3. Use Unconventional Charts and Infographics
Often, basic Excel charts and graphs work well for sharing your data. But sometimes, it pays to be creative. Unique infographics and charts help you share information in new and creative ways.


Even PowerPoint’s built-in chart features are robust enough to craft new designs. Next time you’re linking data to Excel, try out a funnel, waterfall, or sunburst chart. These are tailor-made for custom data sharing. You can use them all when you’re embedding Excel into PowerPoint.
4. Expand Beyond Numerical Data
When you think of data, it’s easy to think of numbers. And of course, that’s likely the most common type of data. But you can use charts and graphics to share data that isn’t numerical. Remember: these are tools to share ideas.
For example, you can use a chart to introduce your team and explain your organization’s structure. It’s a good way to illustrate an idea that may be hard to explain with words alone. And of course, you can embed this right from Excel using PPT tables and more.
For a detailed look at org charts in PPT, view our tutorial now:
.jpg)
.jpg)
5. Be Specific with Design
Premium PowerPoint themes from Envato Elements are available for any subject. Many are well-suited for any topic with a few quick edits. But others are specific and intentional with their themes.


For example, you’ll find many PPT templates geared toward a specific industry. This extends to their layouts, themes, and your ability to embed data. Why not choose a custom, themed template for your next project? These templates look amazing, and they deliver design inspiration on every slide.
Keep Learning More About Excel and PowerPoint
Keep in mind that there are different ways to manage your data based upon the paste option you use. On Envato Tuts+, we have a wealth of resources that help you master both apps!
Dig into more helpful Excel and PowerPoint tutorials on Envato Tuts+:

 How to Make a Gantt Chart in Excel


 How to Make Great PPT Charts & Graphs in Microsoft PowerPoint (+Video)


 How to Embed (& Automatically Link) Excel Files in Word

 How to Track Changes in Your PowerPoint PPT Presentations (Effectively)
Make Great Presentations (Free eBook Download)


We have the perfect compliment to this tutorial, which will walk you through the complete presentation process. Learn how to write your presentation, design it like a pro, and prepare it to present powerfully.
Download our Book: The Complete Guide to Making Great Presentations. It's available for free with a subscription to the Tuts+ Business Newsletter.
Now You Know How to Embed Excel in PowerPoint
Keeping your PowerPoint graphs linked to Excel data is handy. Embedded data gives you the flexibility to edit your data right inside the presentation. It comes down to how you want (or don't want) to keep your data synced between Excel and PowerPoint.
With linked data, you don't have to recreate and reformat your charts each time the original data changes. This embedded Excel in PPT approach ensures you won't forget to make an update. Go practice it now with a presentation of your own!
Editor's Note: This tutorial was first published in July of 2017. It's been comprehensively updated for accuracy by Andrew Childress.