Apple’s share price has increased rapidly in the last few weeks. The rise to $600 was swift and broke the pattern of slow growth the the stock was able to obtain over the past few years. The level, however, shouldn’t have been a complete surprise.
I think Apple is going to $600…It’s really not that complicated. Apple has a number of key drivers in its business model which have yet to be properly priced into the stock because I think it’s very cheap at this level.
-Stephen Coleman, chief investment officer at Daedalus Capital
This prediction was made October 26, 2007. On that date Apple’s share price closed at $184.7. It may have seemed like a bold bet, but as Coleman noted, the reason why it would reach $600 was easy to spot.
The real story on how I get to that valuation doesn’t even involve the sale of (the Leopard operating system) or the growth in the Mac business. How I get there is through the iPhone itself.
What was not easy to tell was when it would reach $600. Back in October 2007 the stock had a P/E ratio of 48. It’s PEG(trailing) was 0.65, and cash per share was $17. Sales were $6.6 billion for the quarter and earnings were 98c/share. If an analyst were to take those ratios and apply a forecast of sales five years hence, the $600 price would have been reached much sooner: Sales had tripled by 2010 and earnings had tripled by 2009. In contrast, the stock took until 2012 to triple.
The delay of one or two years is perhaps reflecting the risk involved in investing. Namely, you can predict outcomes but not their timing.
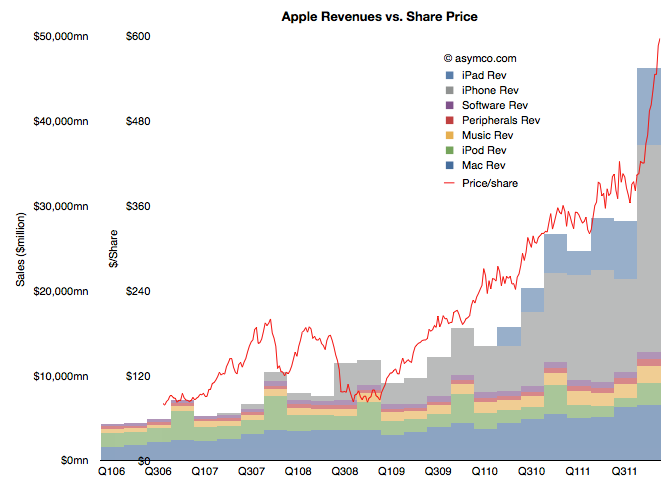
But still, we have to return to the question of why the stock has rallied in the past few weeks. There has been no new information about the company since it reported earnings and any product launches (e.g. new iPad) or increased distribution (China) are completely predictable. Curiously, the market did not react until late in the quarter. The following chart shows the phenomenon.
(Note the two scales on the left: inner is share price, outer is net sales)
It shows the share price as a line superimposed on the sales chart with stacked product revenues. The recent rise can be attributed to the rise in revenues/earnings from the fourth quarter. But why would a stock react in March to data from six months earlier (and published two months earlier).
Classical market theory suggests that markets anticipate and “discount” the future. Efficient markets supposedly react to all available information and do so instantly. If that was the case, the chart above would show the red line shifted significantly to the left.
What we are observing is market inefficiency.
Inefficiency implies that perception of reality is not the same as reality. It happens when people are reluctant to believe the truth. It’s also implies that with $15 billion being “bet” on the share price every day, each one of those bets is misinformed!
The cause of this divergence between reality and perception is that disruptions are divergent from perceptions. A disruptive company always “leads” its valuation. There is cognitive delay for the vast bulk of observers. You can then argue that for those, like Mr. Coleman, that don’t suffer this delay, there will be profit.

