How’s that AAPL harmonic retracement doing?
This is a follow-up to a previous AAPL post where a double bearish harmonic pattern PRZ (Potential Reversal Zone, aka harmonic pattern’s completion zone) had been rejected and there were specific retracement targets awaiting. So how is that harmonic retracement doing? The bigger picture (day chart) is giving clues, but this post also contains an intraday perspective to home in on what’s going on inside the bigger picture.
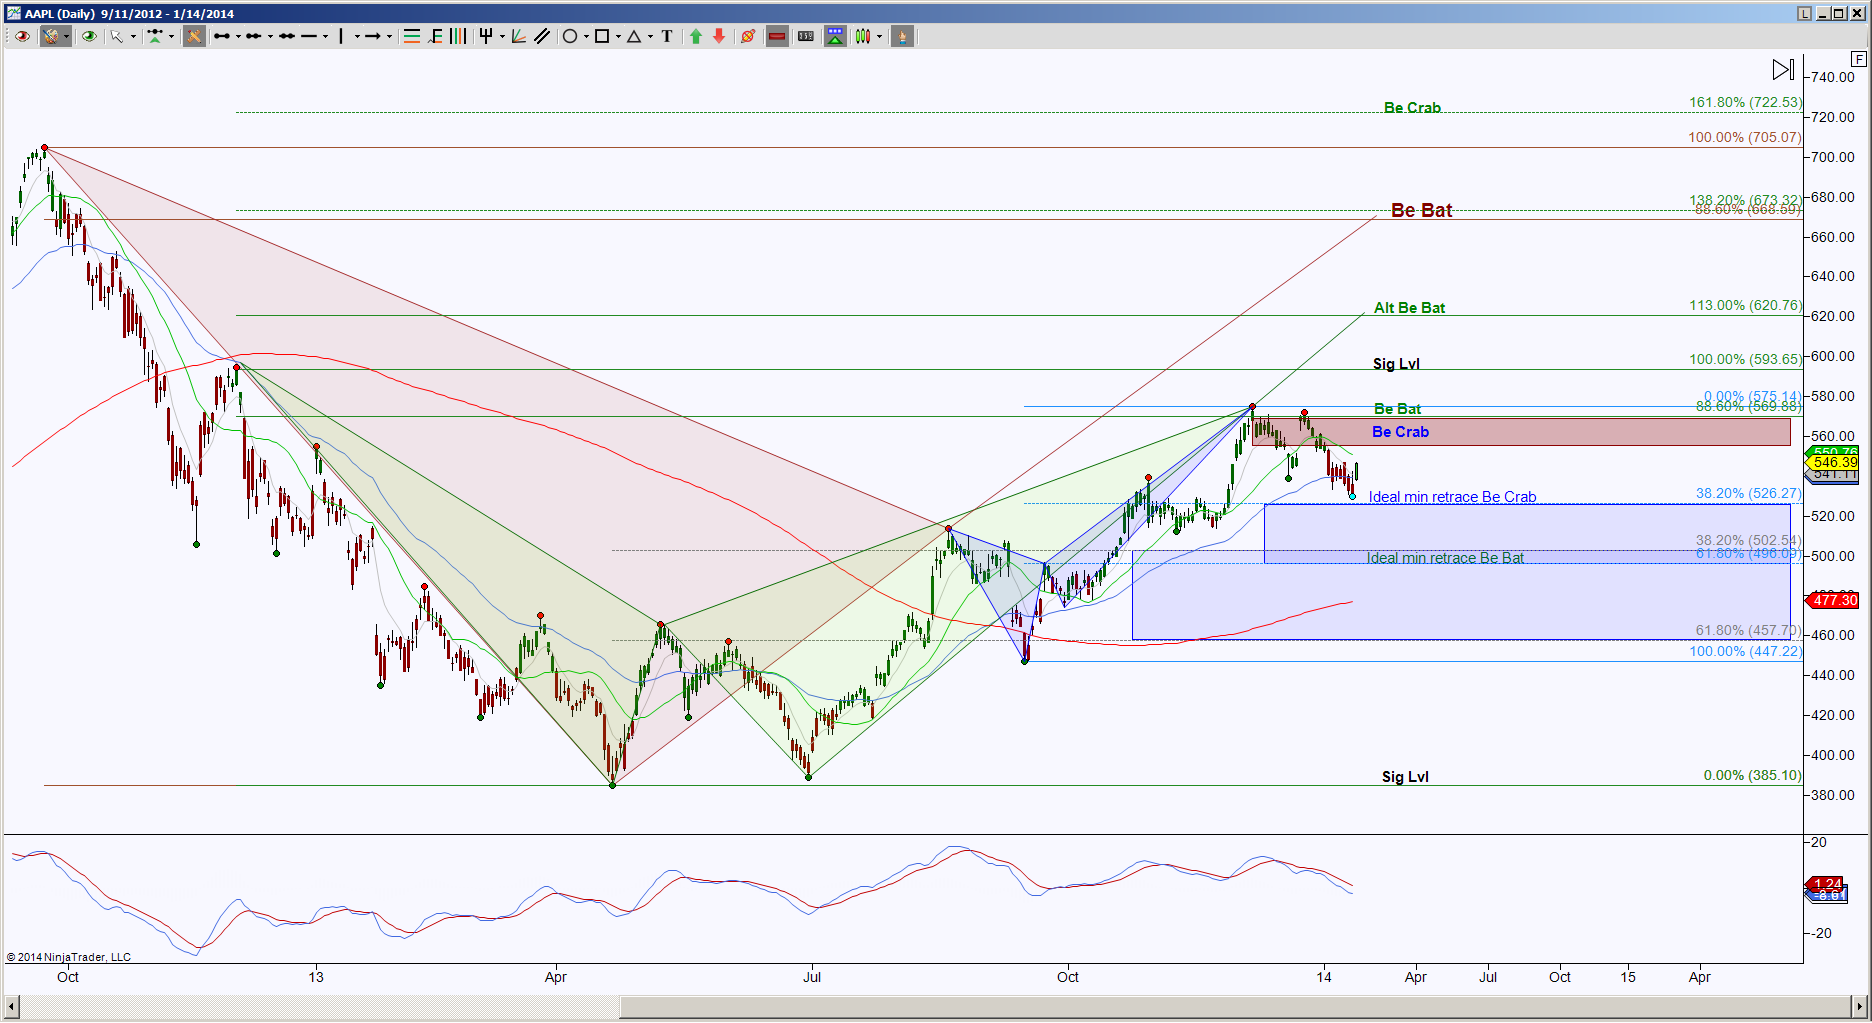
The Day chart then:
The Day chart now:
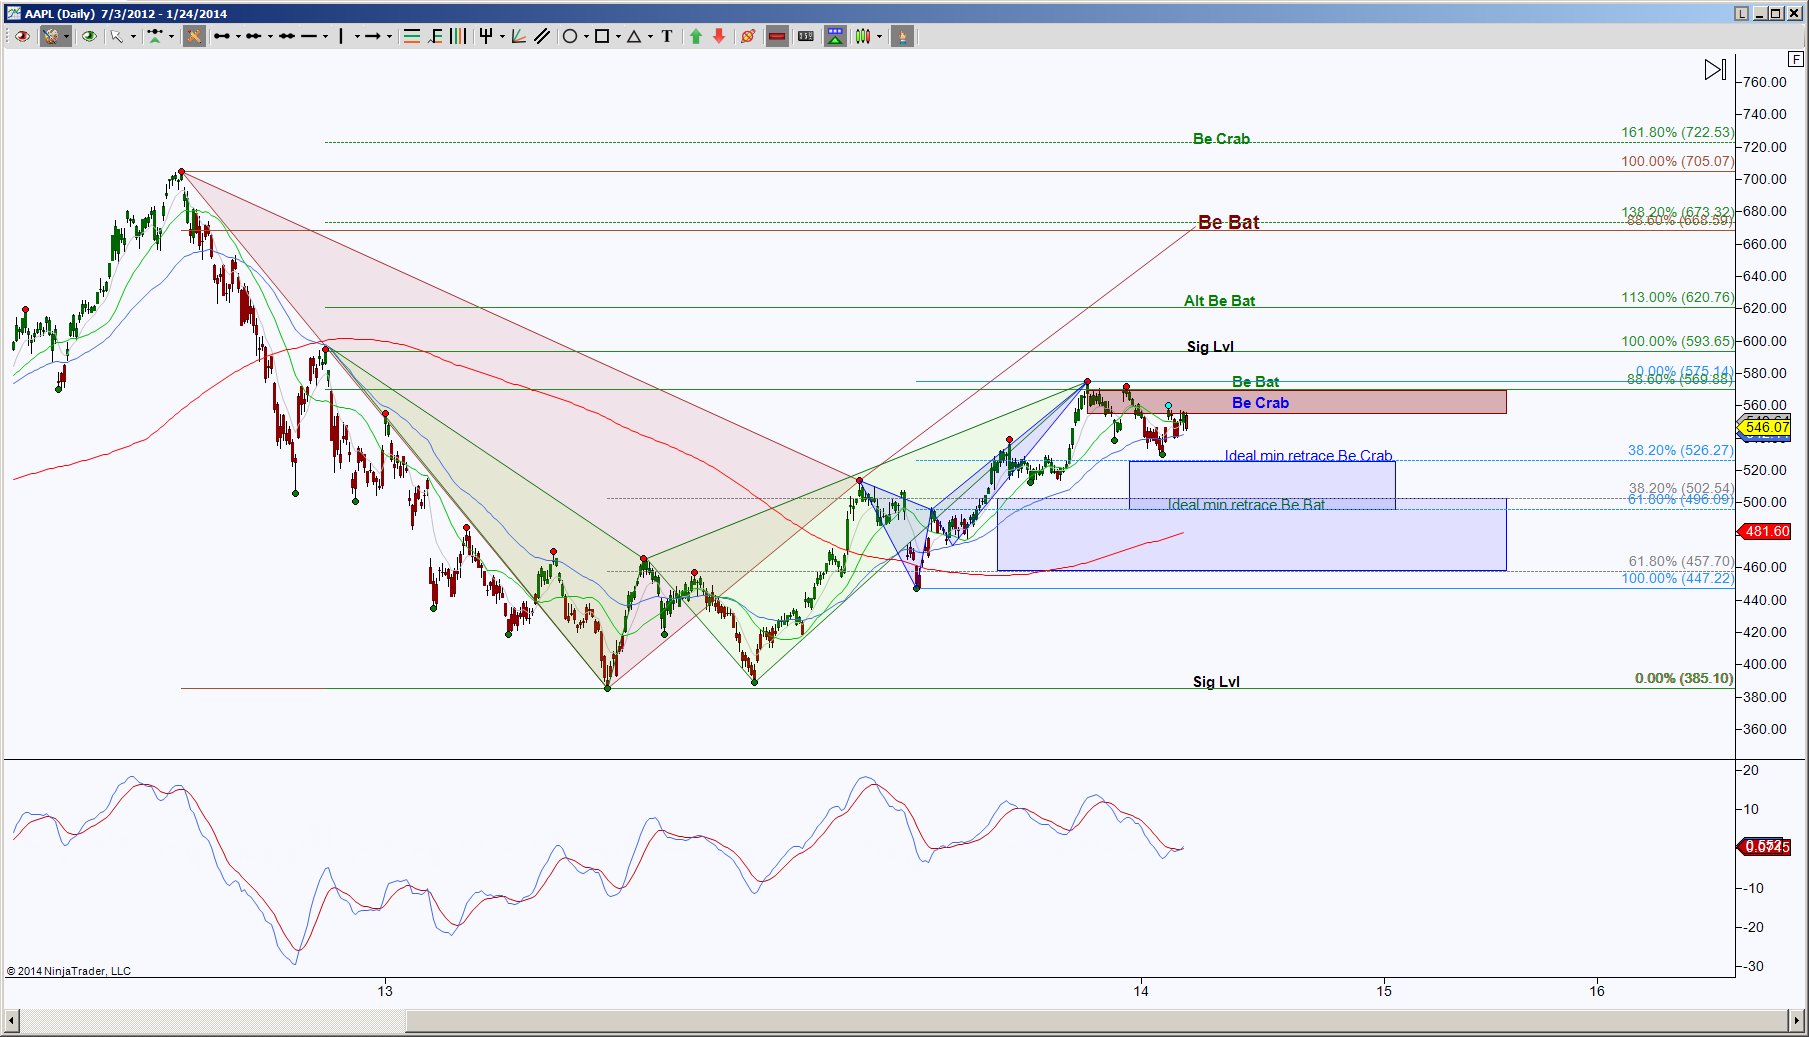
As we can see, so far there has been a shallow retracement, which is typically an implication of continuation of most recent directional bias, in this case, to the upside. However, unless price can hold beyond the top of the PRZ at 569.88, the implication is there’s still a chance of retracement mode. So this is conflicting information which suggests to me there are opposing emerging patterns occurring here. So let’s take it down to a smaller timeframe to get a zoomed-in look.
Warning, the next chart can be intimidating at first glance, but please bear with me.
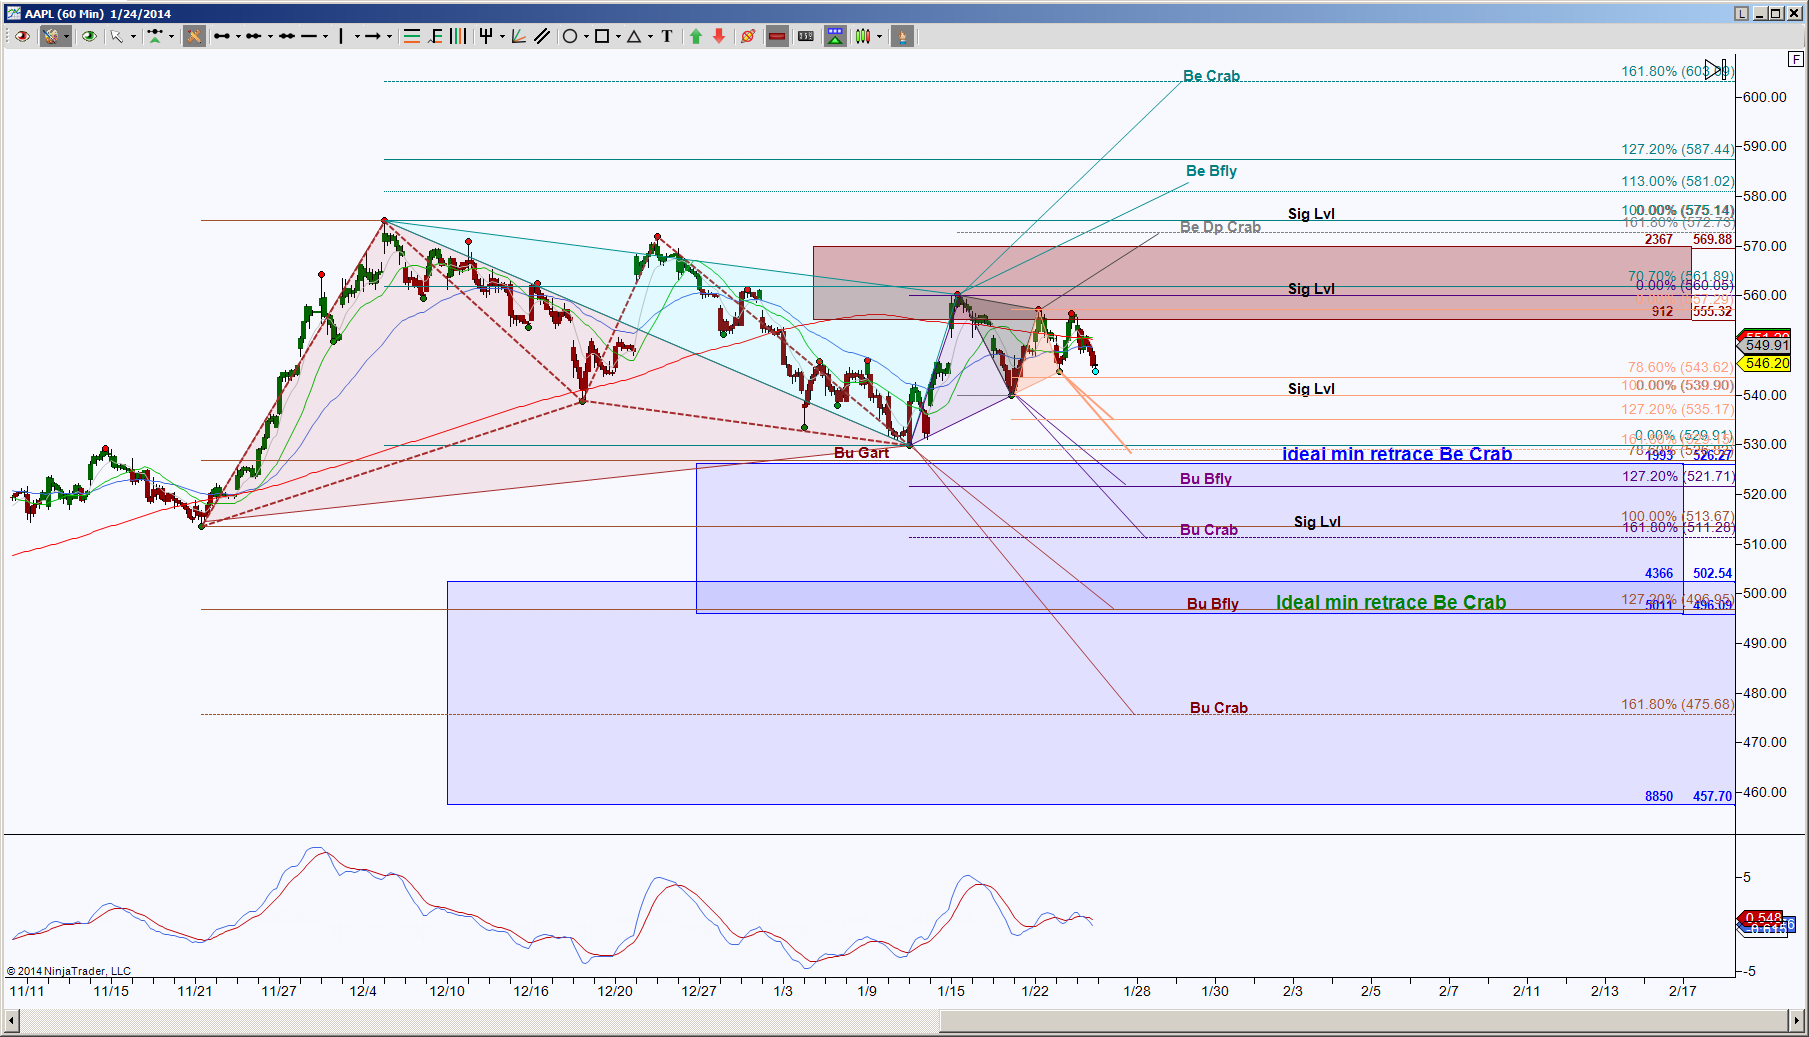
This hour chart shows the daily red PRZ and the ideal retracement zone targets placed on them. It also shows the current timeframe’s multiple opposing emerging patterns.
This is a perfect example of how smaller patterns help larger scenarios play out. I know it can make you dizzy, but the purpose of this chart is to show that harmonic patterns are fractal, that the completion of the smaller patterns helps test larger important levels.
Now that I’ve removed some noise, it’s a bit easier to see the initial opposing emerging patterns (we already know that there are smaller patterns in the works to help these out).
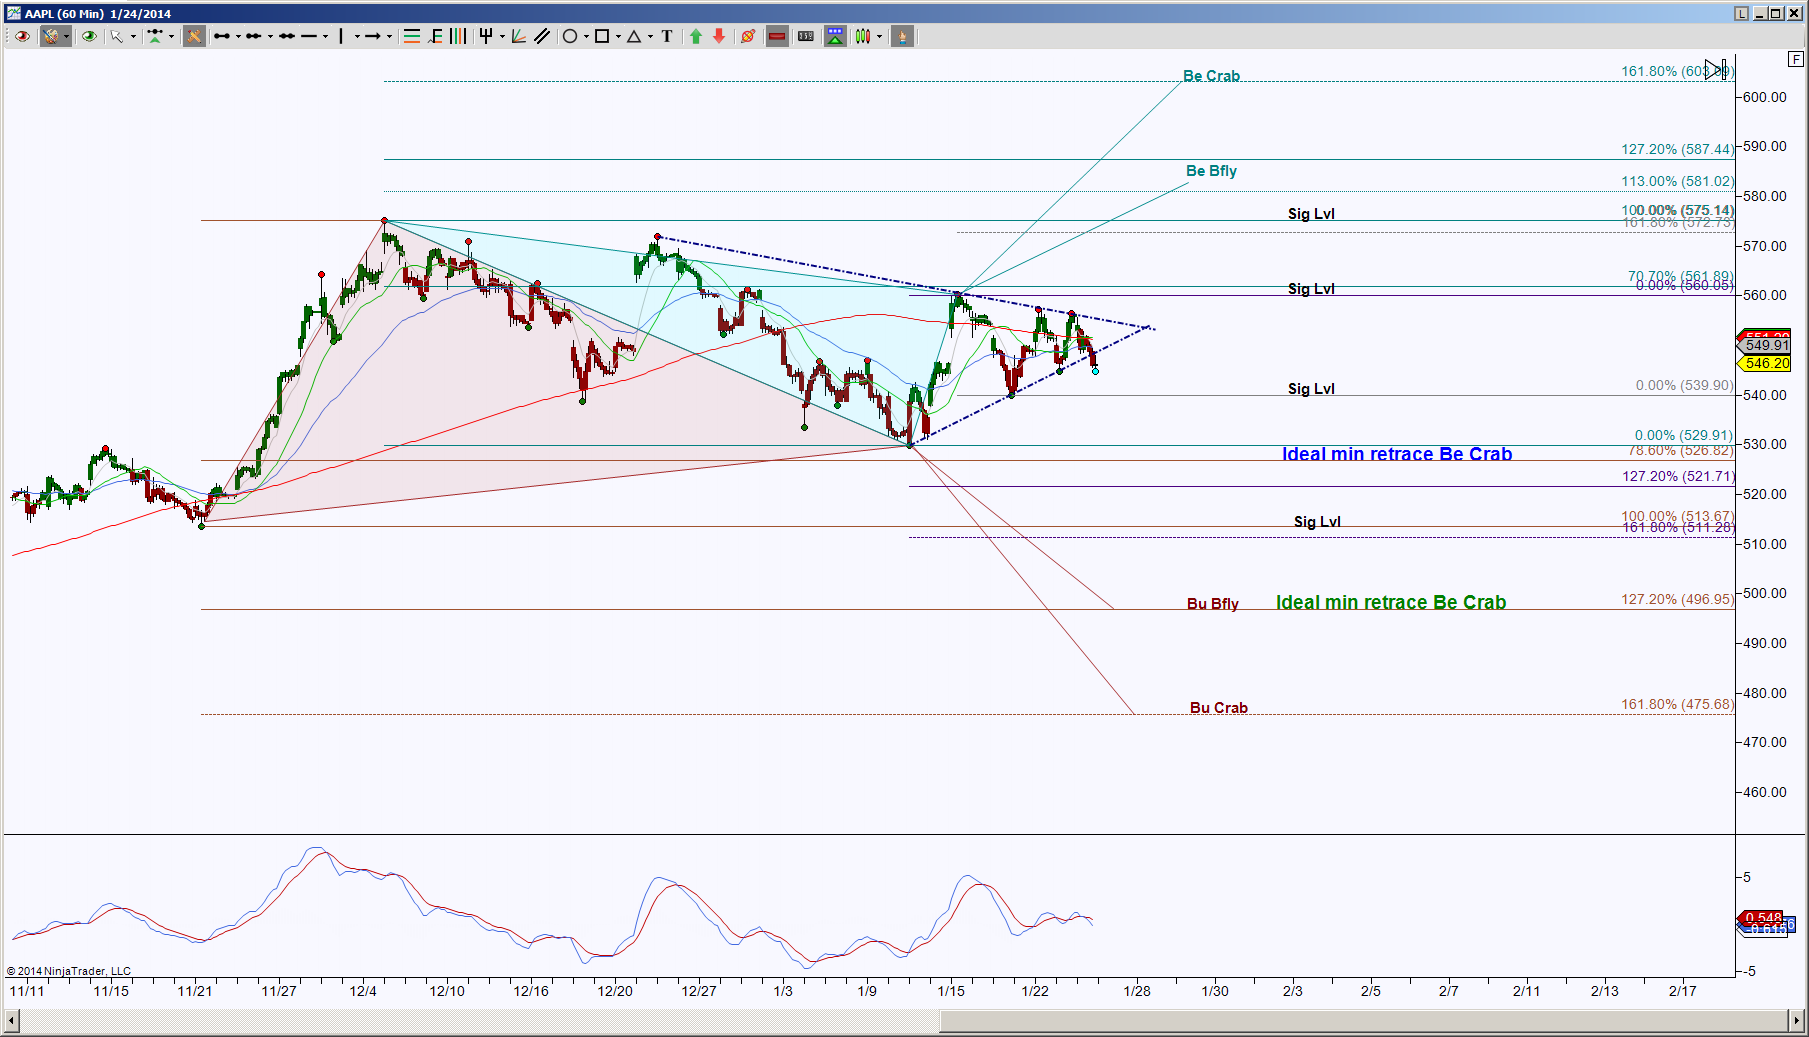
I’ve also added a blue triangle formation that price is currently attempting to break below, so this suggests the current bias is to the downside as long as price holds below this triangle line. Now for the walk-through.
As long as price holds below the blue triangle, a short opportunity occurs to the initial target of 539.90. A hold below there has the next target of 529.91. This is a line in the sand level for the cyan-colored pattern; below it invalidates the cyan pattern, but more important, notice how this test of the cyan’s Do or Die level has helped price near the ideal minimum retracement target for the blue bearish Crab formed in the day chart.
A hold below 526.82 not only invalidates the cyan Butterfly and Crab harmonic patterns, it also increases the probability of completing the brown Butterfly or Crab, which also helps price test the ideal minimum retracement target for the daily green Bearish Crab.
Now it’s really a good idea to be prepared for the opposite scenario. It can be a sickening feeling to have a bias be invalidated and have no plan of action, especially when money is on the line. So, the significant level 539.90 is a potential bounce point, as is all levels labeled Sig Lvl. Failure to break below 539.90 keeps price in a sideways range and there is a possibility of turning from a triangle consolidation into a sideways rectangular consolidation. Until price can hold above 560.05, the consolidation scenario continues.
A hold above 560.05 has the initial target of 575.14. Above there will invalidate the brown butterfly and crab and focus on completing the cyan pattern. So a bounce off 539.90 or hold above 560.05 offers a conservative long opportunity to the ideal target of 603.09 and scaling points of 575.14 (remember, above here invalidates the brown pattern), 581.02 and 587.44.
In a nutshell, the initial triangle breakout and hold offers the first clue, then the significant levels 560.05 or 539.90. Once the hour chart plays out its emerging harmonic patterns, then the scenario on the day perspective becomes clearer: either a respectable retracement or upside continuation probabilities.
