AAPL between harmonic patterns with upside bias
AAPL is in between opposing emerging harmonic patterns but has upside bias with a potential pull back to support.
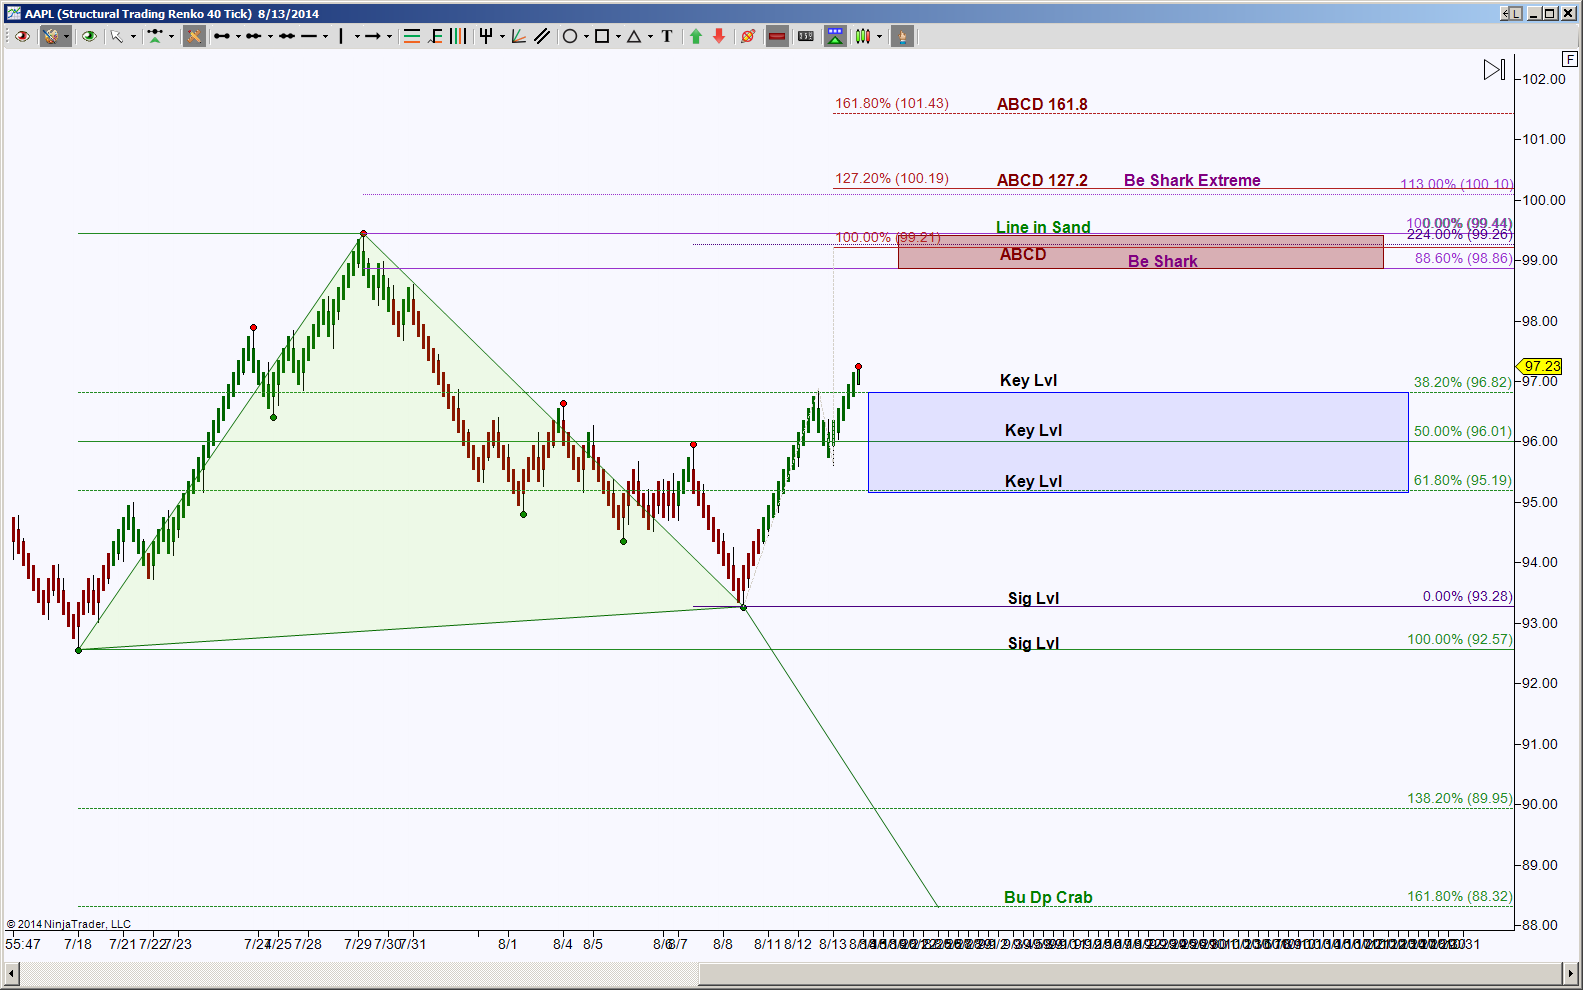
For an intraday chart, I’m using STRenko 40 bar size. This chart shows a potential pull back to test either 96.82 or confluence target at 96.01 for a support test, a hold at these levels offers a long opportunity to the ideal targets above. The initial ideal target is a zone between 98.86 to 99.44, this is called a double bearish PRZ so offers a definite region to scale or protect an existing position. If price can push through 99.44, it invalidates the opposing emerging pattern, a green colored Deep Crab, and a hold above 99.44 has extended targets of 100.10 and 101.43.
If price holds below 96.01, an intraday bias shift occurs with the initial support test target at 95.19, below there increases the probability of testing 93.28 or 92.57, below there has an ideal downside target of 88.32 and scaling point at 89.95.
