
Like a siren, it calls.
The Auto Industry is significant. With gross revenues of over $2 trillion, production of over 66 million vehicles and growing1 it seems to be a big, juicy target. It employs 9 million people directly and 50 million indirectly and politically it must rank among the top three industries worthy of government subsidy (or interference). Indeed, in many countries–the US included–government interference makes it practically impossible for a producer to go out of business, no matter how poorly it’s managed or how untenable the market conditions.
But this might be the tell-tale sign that danger lurks. Theory suggests that incumbents going out of business is an essential indicator of industry health. Without their exit, entrants are never allowed to bring disruptive ideas to bear and innovation simply stops. Is this interference with mortality the only indication of entrant obstacles? Are things about to change? Is there pressure for innovation? Can we spot other indications of a crisis in this industry?
Taking the US as a proxy, here is a graph of the number of new car firm entries (and exits):
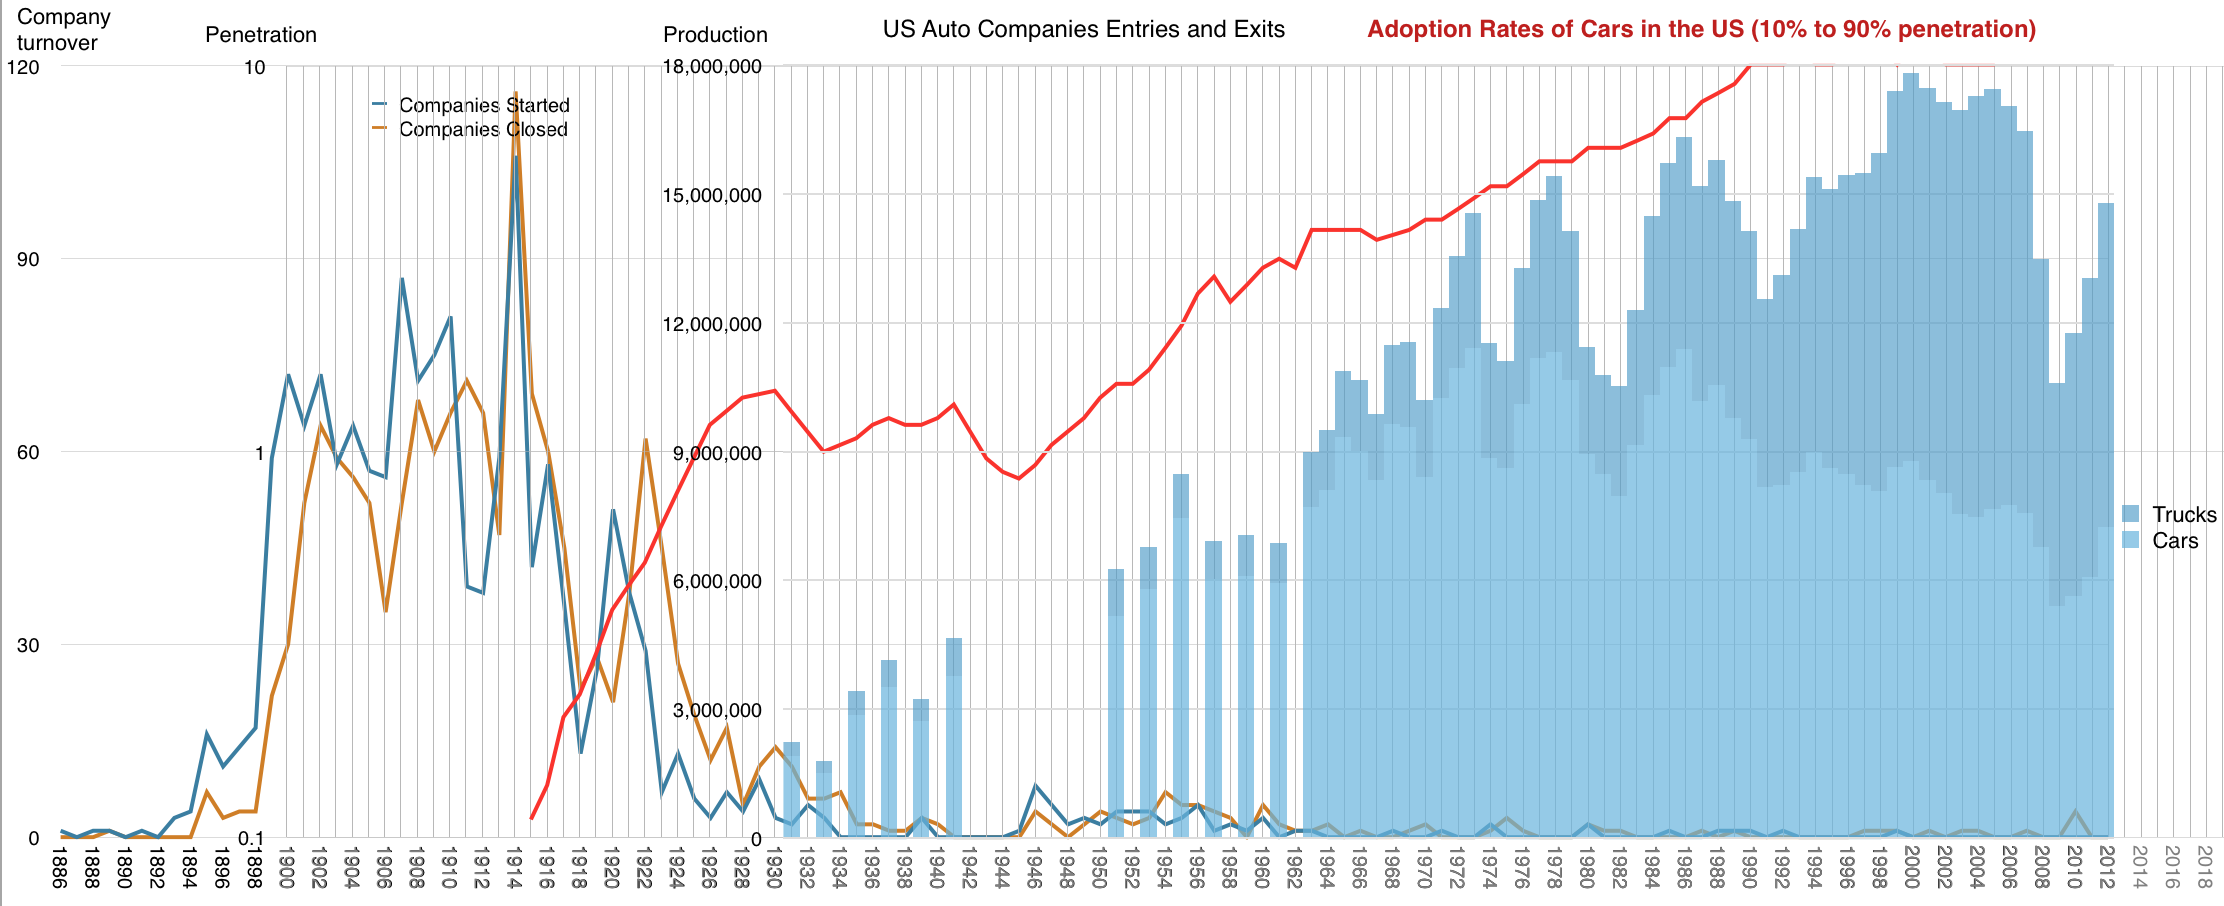
The total number of firms2 that entered the US market is 1,556. The blue line graph shows the entries and the orange line shows the exits. This sounds impressive, but note that the year when the peak of entries took place was 1914, exactly 100 years ago.
1914 was also the year when penetration of the market first reached 10% and the rapid slope of adoption was joined. You can follow this adoption rate as the red line in the graph above34
The first analytical task for the entrant today is therefore to ask why there have been so few others succeeding in the last century. In the last half-century 14 tried and all failed.
One clue is the third set of data plotted above: production figures. The blue area represents the production total for the industry on a yearly basis.5. Note that all three data sets have some relationships to each other: Production growth is dependent on new demand growth and that on a household basis demand ceased growing in 1990. Production and penetration accelerated when entries ended. Given the economies of scale in manufacturing, a consolidation occurred and barriers to entry exploded when volumes became significant.
This leads the casual observer to conclude that production is the predominant consideration for participants and that the entire industry revolves around this measure.
Indeed, production is everything. Capacity utilization is the first priority for an auto manufacturer. Capacity is why firms are not allowed to die and entrants are not allowed to enter.
But you don’t need the data to tell you this. There are other clues. I will summarize these observations in the following “ten commandments” for the industry:
- It’s easier6 to design and build a Ferrari than a Ford. At its logical extrapolation of this rule one can observe that a Formula One team is a trifling hobby compared to the effort needed to build the shabbiest of hatchbacks.
- Low-end disruption happened early in the adoption curve. The very first cars were luxuries, but the Model T from Ford set up the Ford production system as a template for all and it was a low-end disruption. It happened 100 years ago. The Volkswagen Beetle and the Toyota Tercel were also low-end and they built non-US concentrations for production in the 60s and 70s. Same can be said for Mini, Fiat, Renault and Citroen. More recently Korean and Chinese entrants have appeared but they have not been disruptive.
- Almost all meaningful innovation occurs in the production system (not the vehicle). The improvements in vehicles are many but they have not been meaningful in the sense of shifting any of the power in the industry. Certainly not to new companies. The production system innovations of Ford, GM and Toyota allowed them to establish what is to date an unassailable power base of production. If you want to find the next “big thing” in automobiles, look for a new production system.
- To understand how cars will or won’t change, study roads. There were roads before cars, but not paved and not for going far. Road construction and the deep understanding of safety, capacity and economic impact took 50 years between 1920 and 1970 in the US.7 The cars pay for the roads and, as a result, they pay for the logistic system that allowed all forms of powerful businesses to emerge. Walmart, McDonalds and Amazon and the entire retail, food and agriculture sectors owe their existence to the roads that car adoption paid for. Furthermore, the real-estate and entire living structure of many countries depends on roads. If you want to change the car you have to also understand how the roads need to change.8
- There has never been a disruption based on drivetrain innovation. Everything to date has been sustaining. Since 1886, the internal combustion engine has been dominant. Even though there have been diesel, natural gas, all-wheel drive, front wheel drive and electric drive, none of these innovations have changed who controls the profits in the industry. Hydrogen fuel cells won’t either. The reason is simple: incumbents can easily adopt/buy any improvement/innovation as it sustains their production-oriented profit formula. Entrants with drivetrain innovation can’t build a business model moat around the idea without a production base.
- China is the largest producing (and consuming) nation. The global center of production shifted over the years and tends to follow consumption. As a new middle class emerges, the fact that China is leading now should not be surprising. As each new producing center was built, it created an opportunity for local entrants, however they did not displace the incumbents rooted in other markets. This is mainly because they were protected and they were protected because of political considerations including jobs, taxes (roads), etc.
- Almost all car companies own each other. There is a vast cross-ownership network and a disinterest in independence. This is again due to production-led thinking. The spreading of over-capacity or under-capacity risk leads firms to disregard product or market considerations and enter into joint ventures and partial acquisitions. Portions of manufacturers are bought and sold by competitors almost as regularly as they are bailed out by governments. Competition is therefore perverted if not prevented.
- For most motorists, congestion is a bigger problem than any deficiency in the vehicle. We think people want better cars, but they don’t. Cars stopped getting “better” and started becoming worse when congestion became common and congestion became common when saturation was reached. We can’t build more roads (see Commandment 4) and as populations grow, the traffic becomes unbearable. The vehicle’s role switches from freeing to constraining. The industry is adding cupholders to alleviate the problem.
- Contract manufacturing is nearly non-existent. Unlike other industries which modularized long before saturation, automobile manufacturing is largely inter-dependent. You can’t buy your chassis from one maker, the body from another and fit the electronics, user interface and engine from a few others. All available configurations come from one brand. This is symptomatic of the production system leading to innovation insufficiency.
- It’s easier to make a car go fast than to make it go far. This rule is partly corollary to the first rule (Ferrari vs. Ford) but it is also alluding to fuel and energy considerations. Fuel has always been seen as a handicap for the industry. Crises of availability have been around since the 20’s. Somehow demand has led to supply but there are new, unpriced costs to bear. For the industry to continue it needs to solve its own range problem.
All these topics and much more have been discussed in Asymcar, the podcast for those interested in entering the automobile industry.
As technology companies listen to the siren’s song they should contemplate the basis of survival in the industry. Whether your approach and innovation sustains the hegemony or changes it will largely depend on your business model being asymmetric to the incumbent. Determining what is and isn’t symmetric should be the first step in your analysis.
- The industry continues to grow, registering a 30 percent increase over the past decade, mainly due to Asia and China in particular [↩]
- counted as brands [↩]
- The line is on a log graph and shows the P/(1-P) where P is the penetration of households [↩]
- Note that all line graphs have the same x-axis but have different y-axes. [↩]
- The graph is split into cars and trucks. You can plainly see the recessions and the patterns of war and peace [↩]
- read: cheaper [↩]
- Thanks to Steve Crandall for many of these insights. He further notes via Twitter that ~1.5% of the US land mass is paved for transportation [↩]
- Hint: for cars to improve through the reduction in the need to be driven, an understanding of their environment–roads–is mandatory. This is an information problem mainly but it’s also a regulatory and tax problem. [↩]